johndoe@gmail.com

Matt Cochrane, Senior Lecturer (Physics), Edge Hill University, UK
Joe Henesy and Aidan Smith, final-year students: BSc Secondary Science Education (Physics) with QTS, Edge Hill University, UK
This article is based on work from students at Edge Hill University on an undergraduate training programme for science teachers. One of their modules, entitled ‘Investigating Physics’ is an opportunity to explore an area of physics which may be unfamiliar to them.
In the module, students choose a topic and develop a methodology to systematically study the phenomenon over a period of several weeks. This requires careful planning and record-keeping so that the investigation progresses week-by-week. In particular, when designing an experimental set-up, it is necessary to make a careful record of the apparatus at the end of a session so that the experiment can be continued from the same point in the next one. I noticed that many students were using their smartphones to take photographs of the apparatus, rather than the line drawing that I had been brought up to produce. This seemed to me to be an excellent use of new technology, and very soon students were looking for other ways to use smartphones to assist in their experiments. This article gives an overview of some of the experiments which have made use of freely available Apps. One of the student investigations is actually a critique of three Apps which were downloaded at no cost and then tested against more conventional apparatus. Note that all the apparatus used in these experiments is likely to be very familiar in schools.
Using a smartphone or tablet to analyse motion collisions in a game of pool
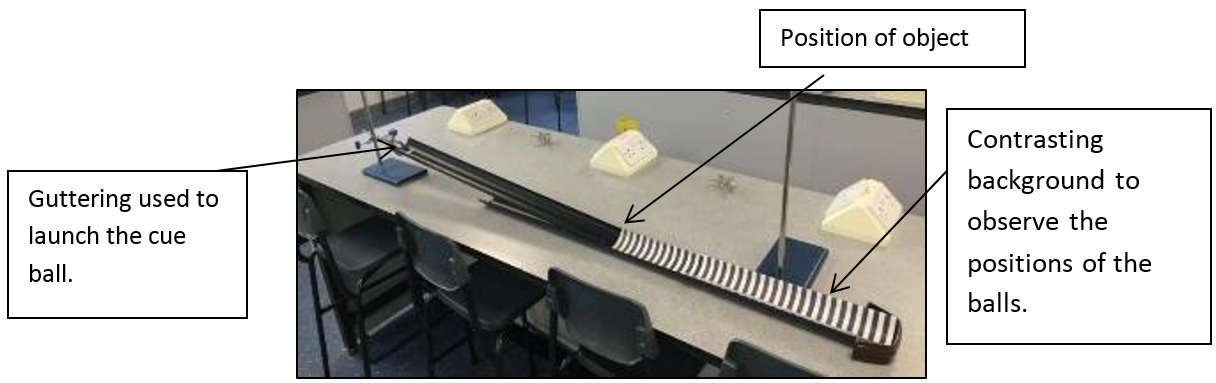
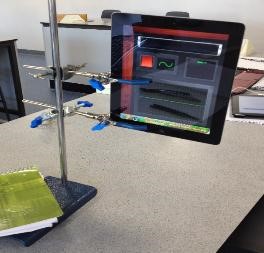
Fig 1: Layout of apparatus. The smartphone is clamped above the centre of the track to provide an overhead shot.
In this experiment, the student launched a striped pool ball (the cue ball) down a ramp towards a second (object) ball. The motion was recorded and then studied frame-by-frame with an app called Ubersense, which displays a time signature in each frame. The ramp was marked with a scale to enable distance to be measured, and the stripes on the pool ball indicated rotational speed.
The student was able to calculate the initial translational kinetic energy (that is, the motion energy it had by travelling in a straight line) in addition to the rotational kinetic energy (that is, the energy it had from spinning), and to study how this energy passed from the cue ball to the object ball.
Energy and momentum must be conserved in collisions such as these, but the fact that the cue ball is spinning at the point of collision makes the process more complicated, and the video analysis enables the two different components (the spin energy and the straight-line energy) to be considered separately.
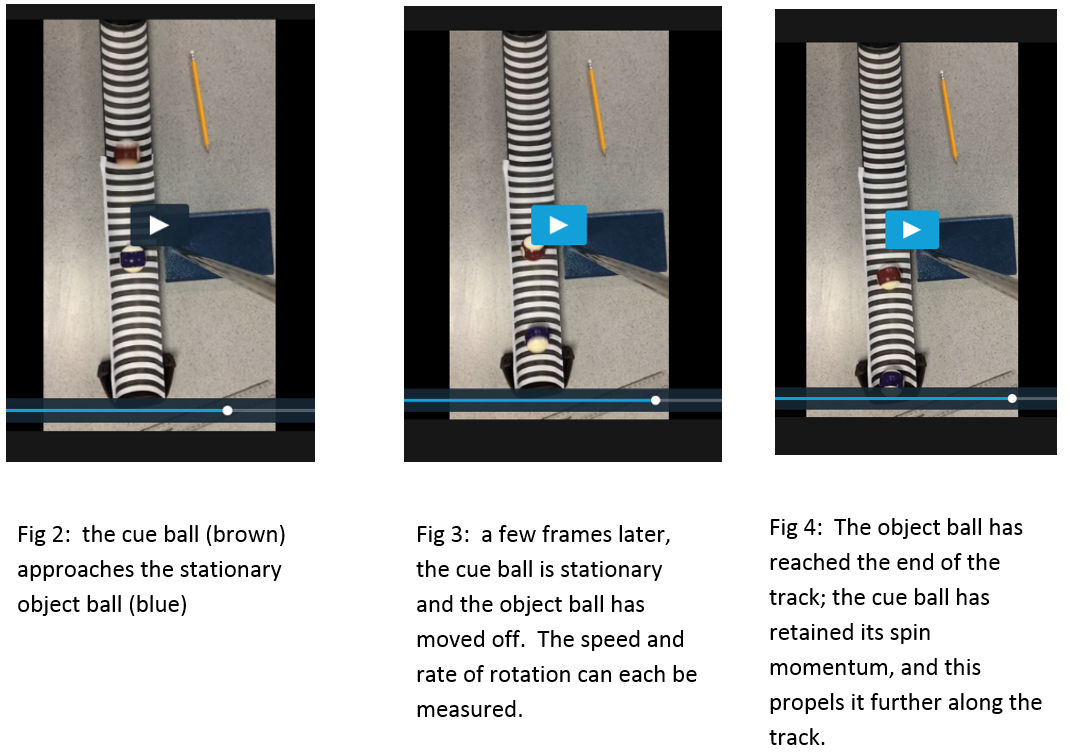
Figures 2-4 (stills captured from the video) show the progress of the ball
The white dot on the progress bar can be used to measure time accurately against the blue/yellow scale below it (marked in full seconds here). The angle of rotation of the balls can be measured (e.g. approx. 720° for the blue ball from fig 2 to fig 4, and 90° for the brown ball from fig 3 to fig 4).
The clips can be loaded into the Ubersense software and further analysed in slow motion, which enables full account to be taken of both rotational kinetic energy and momentum, and translational ke and momentum.
Using a tablet as an accelerometer
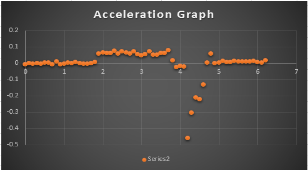
This student aimed to verify Newton’s Laws of Motion by using a tablet to measure the acceleration. Most devices these days are fitted with a motion sensor, and apps can be found which will measure “g-force”.
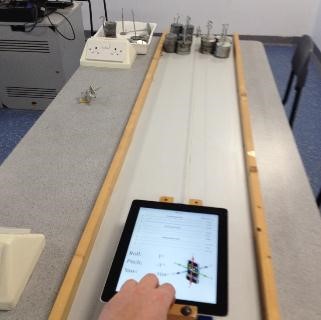
In the illustration, the tablet is resting on a dynamics trolley which is about to be released and pulled by a string attached to a falling weight.
A number of apps were tried, all of which recorded acceleration as a multiple of g in each of the three dimensions. It is not difficult to set the tablet on the trolley so that its motion is along just one axis however, and the value for acceleration can easily be calculated from the known value of g. The graph below shows the trolley initially at rest, and then after 2 seconds undergoing an acceleration (constant) of around 0.05g, or 0.5ms-2. This was found to be consistent with the value calculated from the laws of motion. Note that when the trolley reaches the end of the runway it experiences a very large (and brief) negative acceleration as it hits the barrier and comes to rest.
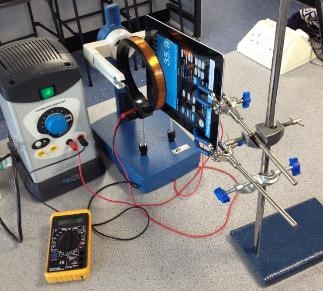
Measuring magnetic field
Helmholtz coils are typically used to create a uniform magnetic field around electron beams to demonstrate the deflection of the electrons due to the field. Normally, the strength of the field can be calculated from the current and dimensions of the coil, but the formula to do this is arcane, and detracts from the rest of the experiment. It is much simpler to measure the field directly using a Hall Probe connected to either a data logger or oscilloscope. In the latter case, further data processing is required to arrive at a value. (And the use of the Hall Probe can add to the complexity of the procedure)
Once the app (“iEMF+”) is running, it displays the magnetic field running normal to the surface of the tablet. As seen in the illustration below, it displays the value (in Tesla or microTesla as soon as the app is running. This student measured the magnetic field with the tablet at various values of current and found very close correlation (±1%) with the calculated value up to a limit of about 1500 microTesla.
This is ample field to observe electron deflection in the type of tube typically used in A-level demonstration apparatus.
Similar apps have been used in the past to investigate the Earth’s magnetic field (it can readily be positioned to test values in each dimension, and looking for the orientation which gives the maximum value, thus enabling measurement of the angle of dip of the Earth’s field.
Measurement of frequency
The App “tuner HD” was used to test the capability of the tablet for measuring sound frequencies. Its marketed us is as an instrument tuner. Tuning forks, which normally are stamped with their fundamental frequency, can be placed close to the tablet, which then displays a waveform and value for the frequency.
The student found agreement at better than 1% in the stated and measured values. The app also measures